Antesky is a professional earth station antenna manufacturer, based on our experience between our customers, we found some customers’ testing methods are with some difference, so we’d like to share our earth station antenna testing method here for your reference.
And we will introduce our testing method for earth station antenna including Radiation Pattern, Gain and Efficiency, Noise Temperature, G/T value, Polarization Isolation, Step Tracking Accuracy, Control resolution of antenna position, test the antenna reflector.
1.1 Radiation Pattern
1.1.1 Test Method
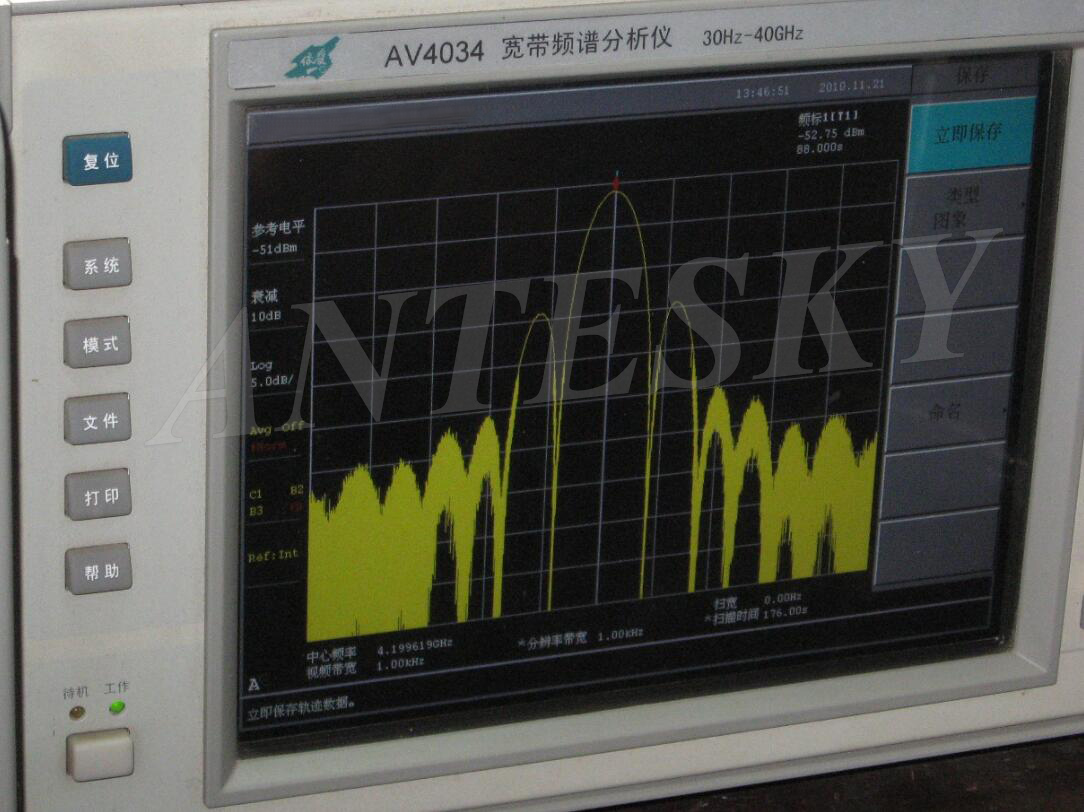
Measure the Radiation pattern of an earth station antenna by using the corresponding band of the synchronous satellite beacon to do the pattern.
1.1.2 Block diagram of Test
As shown in Fig.1
Fig.1 Block diagram of Pattern measurement
Spectrum analyzer
1.1.3 Test Step
- According to the illustrated drawing, connect the equipmentand make sure that the test system in normal operation condition.
- Adjust the antenna to point to the selectedsatellite;
- Make the antenna point to the Satellite and also make the beacon signallevel maximum.
- Fix Azimuth, move down the antenna maximum onEl axis, stop moving until obtaining the sidelobe of far angle;
- Rotate the antenna on El while operatethe spectrum analyzer, and get the El pattern;
- Printout the Elevation pattern, read the sidelobes levels of both sides by ∇Mark function of the spectrum analyzer;
- Return to maximum value by manuallycontrol antenna;
- Fix El & Az, move the antenna maximum CCW on the Az;
- Rotate the antenna CW on Az while contact the spectrum analyzer and get the Az pattern;
- Output the azimuth pattern through camera, read the sidelobes levels of both sides by the spectrum analyzer, and record it on the pattern.
1.2 Gain and Efficiency
1.2.1 Test Method
Measure 3dB beam width by satellite beacon and calculate the earth station antenna gain and efficiency, measure it by selected satellite and beacon, the same method as the antenna pattern. The angle indicator accuracy of antenna servo system is high, so test it by the method of subtraction between antenna angles which is read directly.
1.2.2 Block diagram of testing.
Block diagram of antenna gain and efficiency, as well as the pattern test are shown in Fig.1
1.2.3 Test Steps
- According to the illustrated drawing, connect the equipment and and make sure that the test system in normal operation condition;
- Adjust the antenna to point to the selected satellite;
- Make the antenna point to the Satellite and also make the beacon signal level maximum;
- Set up the spectrum analyzer parameters as 1dB/div;
- Fix Azimuth, drive up the antennamaximum to make the signal indicated by the spectrum analyzer down 3dB , and record the El data EL3dBU of the antenna servo system;
- Drive down the antenna, monitor the spectrum analyzer to get another El 3dBpoint, record the El data EL3dBD of the antenna servo;
- The absolute value of difference between two points of 3dB is El 3dB width, and record it as θ3dBEL=EL3dBU– EL3dBD;
- Return to maximum value by manuallycontrol antenna;
- Fix El, drive the antenna maximum CWand make the signal indicated by spectrum down 3dB, and record the Az data AZ3dBW of the antenna servo system;
- Drive the antenna AZCCW and find another 3dB point, and record the Az data AZ3dBE of the antenna servo system;
- The absolute value of difference between two points of 3dB is recorded as AZ3dB=AZ3dBW – AZ3dBE;
- So Az 3dB width θ3dBAZ is

In which, EL0=(EL3dBU + EL3dBD)/2 is the El angle when the antenna pointing is maximum;
- For the other selected beacons, repeat above steps and get 3dB beam width.
1.2.4 Obtain antenna gain and efficiency by 3dB beam width
The formula of estimating the antenna gain by antenna pattern of 3dB beam width is as below:
Where, take K as 29000.
So the antenna efficiency is as below: η=G(λ/πDm)2
In which,![]() ,Dm is the antenna diameter.
,Dm is the antenna diameter.
1.3 Noise Temperature
1.3.1 Test Method
Test the earth station antenna noise temperature by “Y” factor. Connect LNA with antenna system of standard load in normal temperature and the antenna system of pointing to a better environment separately, test “Y” factor of the antenna system and obtain the noise temperature of the system. Note: The better environment means no water, no trees, no metal obscure, and no Satellite signal and avoids the direct sunshine to the reflector.
When testing “Y” factor, try your best to make the spectrum analyzer close to LNA so as to reduce the impact of RF transmission cable. In order to improve the testing accuracy, you can obtain the average value by several more tests.
1.3.2 Test block diagram
Test block diagram of “Y” factor is shown in Fig.2
Fig.2 Block diagram of Noise temperature measurement
1.3.3 Test Steps
- According to the illustrated drawing2, connect the equipment and make the test system to work normal.
- Adjust the antenna to point toa better environment area of selected angle; Note: The better environment area of the selected angle means no water, no trees, no metal obscure, no Satellite signal and avoid the direct sunshine to the reflector
- Set the frequency of spectrum analyzer to the desired frequencyband and make it work in the mode of single sweep;
- Connect LNA on the feed , contact the spectrum analyzer and record the noise level of the tested frequency;
- Connect LNA with the load in normal temperature, contact the spectrum analyzer and record the noise level of the corresponding frequency;
- Subtraction of difference value between the two noise levels, which are the corresponding frequency connecting with the load in normal temperature and the one connecting with LNA, is “Y”factor, and record it as Y(dB);
- Repeat the other frequencies and antenna operational El untilfinishing all.
1.3.4 Obtain the noise temperature by “Y” factor
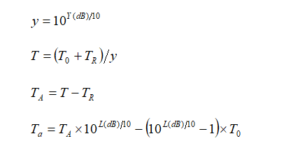
According the tested Y factor calculate each antenna noise temperature by following formula
Where,
Y Y factor (dB)
T Noise temperature of the earth station system(K)
T0 T0(K)=273+t0 (°C) Environmental temperature(K)
TR Noise temperature of LNA(K)
TA Noise temperature of Antenna system(K)
Ta Noise temperature of antenna (K)
L Insertion loss of feed network(dB)
1.4 G/T value
Calculate G/T value by the G and T value obtained by the above method.
In which, G is the earth station antenna Gain, its unit is dB
T is noise temperature of receiving system, that is TA,its unit is K
LF is the Feeder loss, and its unit is dB
1.5 Polarization Isolation
1.5.1 Test method
Test it by Satellite beacon
1.5.2 Test block diagram
Test block diagram of Polarization Isolation is shown in Fig.1
1.5.3 Test Steps
- According to the illustrated drawing, connect the equipment and make the test system to work normal.
- Adjust the antenna to point to the selected Satellite;
- Select the beacon with strong signal strength, adjust the spectrum analyzer parameters, and set up appropriate sweep time;
- Make the antenna point to the Satellite and make the beacon signal level maximum, and record the signal level value at this moment;
- Keep all the spectrum analyzer parameters not changing, connect LNA( or LNB ) withanother output of the feed and record the signal level value at this time, so the polarization isolation is the subtraction between the two levels.
- For the other selected beacons, repeat the above steps and test the polarization isolation.
1.6 Step Tracking Accuracy
Test it by Satellite beacon
1.6.1 Test block diagram
On-site testing system consists of tracking system, controlled antenna system and spectrum analyzer, as shown in Fig.3
![]() Fig.3 Block diagram of tracking accuracy measurement
Fig.3 Block diagram of tracking accuracy measurement
1.6.2 Test Steps
When testing the step tracking accuracy, you should select a satellite with small drift and stable beacon as the aim satellite.
- Make the antenna point to the aim satellite (Observe by the spectrum analyzer and make the tracking signal maximum), read and record the antenna Az position Pe0and El position Pe0at this time.
- Set up the tracking signal loop;record the tracking signal frequency F0. Adjust the gain of the tracking loop to make the tracking level as about 6V, and also set this signal level as the maximum level.
- Control antenna Az and El to deviate from the Satellite appropriately, then start step tracking. When the step tracking becomes in waiting state, read and record antenna Az position Paiand El position Pei, So
Az tracking error at this time (Considering the secant compensation)
∇ai=|(Pai-Pa0)cosPe0|,
El tracking error at this time
∇ei=|Pei-Pe0|.
- n(n³10)times repeat the Step 3, Az and El should be deviated to different direction, and get a group of tracking error data, so the tracking accuracy is
1.7 Control resolution of antenna position
1.7.1 Test block diagram
Block diagram of testing and step tracking accuracy
1.7.2 Test Step
Control the earth station antenna in motion by manual position mode, observe the changes after the antenna gets to the aim position, and record the maximum value ∇Pmax of the antenna position change, so the control resolution of antenna position is ∇Pmax/2.
1.8 Test the antenna reflector
1.8.1 Test Method
1.8.1 Test Method
1. Method of template detection
2. Test Steps
-Use the calibrated template to test each measurement point by centimeter check
– According to the RMS formula, calculate the reflector accuracy.
Antesky has done many antennas testing with the customers by using these methods , such as 7.3m C/Ku dual band antenna, 9.0m C/Ku dual band antenna, 4.5m Tx/Rx antenna, 6.2m Tx/Rx antenna and 7.3m Tx/Rx antenna…etc. If you are interested in these antennas, please WhatsApp us here directly or you can contact with us via sales@antesky.com. thanks!


